Paper Opening Science to the New Statistics Proves Its Import a Decade Later
The presumed misuse or even abuse of statistics is widely suspected among the innumerate, but awareness even by skilled practitioners that some common aspects of everyday use are, well, “weird” is less remarked upon publicly but no less real. That was certainly the state of affairs a decade ago when the editor of the journal Psychological Science approached an expert in the area of statistical cognition — the study of how people understand or misunderstand statistical concepts — to pen an article on making use of new and less weird statistical methods that accompanied the rise of Open Science.
That article, “The New Statistics: Why and How” by Geoff Cumming, has proved remarkably popular in the years since and is the third-most cited paper published in a Sage journal in 2013. As a result, the paper and its author have received a 10-Year Impact Award from Sage (the parent of Social Science Space).

This is the fifth year that Sage, the parent of Social Science Space, has awarded 10-Year Impact Awards to the top three most-cited papers of the past decade. As Sage’s president of global publishing, Ziyad Marar, explains, “The impact of academic research, especially in the social and behavioral sciences, often goes beyond the standard two-year citation window. These awards extend that period to 10 years, recognizing work with a deep and lasting impact that might be overlooked in the short term.
Cumming is a professor emeritus of Australia’s La Trobe University, having “retired” in 2008 after four decades teaching but nonetheless maintaining an extremely active presence in promoting new statistics and his books and online writings about them. We asked Cumming several questions about his statistical journey and how he came to write the paper and evangelize for better understanding — and hence better use — of statistics in science.
What was it in your own background that led to your article?
As a teenager, I remember my father giving me a simple explanation of significance testing. I said something like, “That’s weird, sort of backwards. And why .05?” He replied, “I agree, but that’s the way we do it.”
Later I often taught intro statistics in psychology. No matter how I tried to explain null hypothesis significance testing (NHST) and p values correctly and simply, some thoughtful students would exclaim something like “Weird, backwards!” and I had to say, “I agree, but that’s how we do it.” I wondered how many good students we lost because they couldn’t accept such weirdness.
I wanted something better than NHST, especially given cogent arguments like Paul Meehl writing in 1978 that “the whole business [NHST] is so radically defective as to be scientifically almost pointless.” Similarly, Gerd Gigerenzer and David Murray wrote in 1987: “It is remarkable that despite two decades of… attacks, the mystifying doctrine of null hypothesis testing is still today the Bible from which our future research generation is taught”.
I always taught confidence intervals (CIs) as well. These seemed more informative and students seemed to get the basic idea easily. Then I discovered that things went much better if I taught CIs first and NHST only later. It was slow, but my thinking was advancing!
Was there an article that had a particularly strong influence on you?

Those early critiques of NHST had me looking for something better, even if NHST was in every textbook and what journal editors wanted. Were researchers addicted to p values?
Then I discovered Ken Rothman’s campaign in medicine to promote CIs. He persuaded a large group of medical journal editors to state in the mid-1980s that CIs should be included in all empirical articles. Rothman even started his own journal, Epidemiology, with the policy of publishing no NHST, no p values at all, just CIs. The sky did not fall in! In psychology, Geoff Loftus worked hard to encourage error bars rather than NHST when editor of Memory & Cognition, but the changes did not stick after his departure.
The article I found most striking and helpful was by Frank Schmidt (1996). He wrote: “Psychology still emphasize[s] statistical significance testing, despite numerous articles demonstrating its severe deficiencies. It is now possible to use meta-analysis to show that reliance on significance testing retards the development of cumulative knowledge.” His article was a revelation! I eagerly boned up on meta-analysis. I also developed a visual demonstration of his main argument—at first on overhead transparencies (remember those?), eventually in Excel.
What did Schmidt’s article lead to?
About 2003 I started including a simple explanation of meta-analysis in my intro course, using an Excel forest plot I’d built. I was delighted: Students found it easy and natural to understand how combining results over studies just made sense. Of course, for meta-analysis you need a CI from each study, while p values are irrelevant, even misleading.
Schmidt used a table of the simulated results of a sequence of random samples from the same population. The p values from successive samples bounced wildly! I made a visual version in Excel, which developed over the years into the dances.
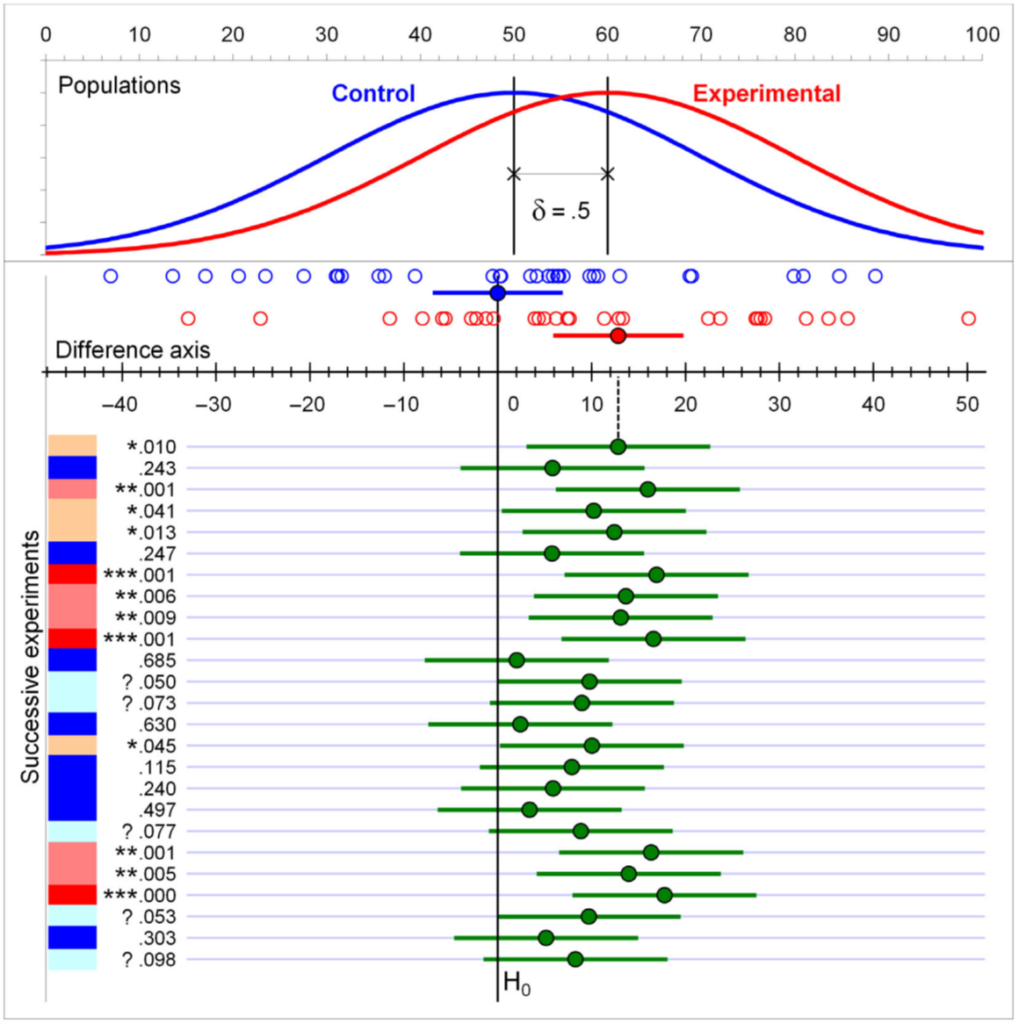
Figure Dances of means, confidence intervals, and p values. At the top are the populations, each with SD=20, and means separated by 10, half the population SD. Then are displayed the latest two samples, each n = 32, with sample means and 95% CIs, the open circles marking individual data points. The top green dot marks the (experimental–control) mean difference for the latest samples and is shown on the difference axis. The vertical line marking the null hypothesis, H0, is lined up with zero on that axis. The top green CI falls a little way from that H0 line, corresponding with the top p value of .01. The difference axis and all earlier green means and CIs bounce left and right as successive replications are taken, the zero on that axis always being lined up with the latest Control sample mean. The p values are marked *** for <.001, ** for <.01, * for <.05, and ? for .05<p<.10. Colours range from bright red for *** to deep blue for p>.10. (Figure 1 from Calin-Jageman & Cumming, 2024)
The figure illustrates the dances. Focus on the green dots, which drop down the screen as the simulation runs, illustrating the sample means dancing side to side: the dance of the means. Focus on the green line intervals to see the dance of the CIs. Those two dances are simple pictures of sampling variability in action. Now focus on the column of p values at left. Each p value corresponds to where its CI falls in relation to the vertical null hypothesis line, yet they bounce around dramatically: the dance of the p values. Repeat the study and find just about any p value! Any single p value can’t be relied on, doesn’t deserve our trust! Decades of rational argument hadn’t seemed to weaken researchers’ addiction to p values much. Could a dramatic demonstration of the unreliability of p help?
In 2009 I uploaded my first video of the dance of the p values to YouTube. Search YouTube for ‘dance of the p values’ to find that, and two later versions from 2014 and 2018.
I decided that estimation and meta-analysis, both based on CIs, were the way to go—I labeled these the new statistics, with minimal, if any, role for p values. Of course, those techniques are not new, but using them as the primary approach to data analysis would be new for many disciplines, and a great step forward.
I became passionate about advocating the new statistics. In 2008 I ‘retired’ (i.e. gave up the salary) from La Trobe to write Understanding The New Statistics: Effect Sizes, Confidence Intervals, and Meta-Analysis, which came out in 2012. The first three chapters explained why NHST and p values were so misleading and why estimation is far superior. I explained how to use CIs for various measures and simple designs. There were three chapters on meta-analysis. The book used my ESCI (Exploratory Software for Confidence Intervals) in Excel for simulations and data analysis throughout. That book helped move things along, at least a little.
What was happening in psychology at about that time?
Extremely important developments! There was increasing recognition across many disciplines of the replication crisis: Many studies in even the top journals could simply not be replicated.
John Ioannidis’s 2005 article, “Why most published research findings are false” made a key contribution to understanding the replication crisis by explaining how reliance on NHST led to (i) selective publication of only ‘significant’ results, (ii) cherry-picking and other questionable practices to achieve ‘significance,’ and (iii) a belief that any published ‘significant’ result was real and did not need to be replicated—and anyway funders and journals showed little interest in replication. Strong justification for adopting the new statistics!
Largely in response to that crisis, Open Science arrived—perhaps the most important advance in how science is done for a very long time. Its aim is to make research more open, trustworthy, and replicable. The annual conventions of the Association for Psychological Science (APS) in about 2013, 2014, and 2015 were the most absorbing and rewarding of any conference I’ve attended: It was inspiring to hear discipline leaders discuss how to achieve Open Science progress, with particular attention to improved statistical practices.
Eric Eich was editor-in-chief of Psychological Science, the flagship journal of APS. His dramatic initiative in 2014 marked the arrival of Open Science in psychology. His famous editorial “Business Not As Usual” came first in the January 2014 issue. Months earlier Eric had invited me to write a tutorial article on the new statistics, including their advantages and advice about how to adopt them. After refereeing and revision, Eric published the final version, titled “The New Statistics: Why and How,” immediately following his editorial. Eich’s new statistical guidelines included a recommendation to use the new statistics to avoid problems associated with NHST. My tutorial, and a series of six videos APS made of my new-statistics workshop at the 2014 convention (https://tiny.cc/apsworkshop), were designed to help researchers follow the journal’s recommendation.
What has been the reception of the article?
Mainly very positive, I’m pleased to say. Some advocates of Bayesian methods have argued that my focus on frequentist methods, especially CIs, was narrow or even mistaken. I welcome the development and use of Bayesian methods, especially Bayesian estimation and meta-analysis (the Bayesian new statistics). I have chosen to focus on CIs as being much more familiar to most researchers and therefore much more likely to be taken up widely than Bayesian estimation, at least in the short term.
The section Simply do not use NHST (p. 26) received some negative comment. Many regarded it as taking an extreme position, even if Ken Rothman, Frank Schmidt, and others would agree with me. Since 2014, p values continue to be used, although I like to think that the much greater use of CIs and meta-analysis has led to p values being less influential. I dearly hope the fading of the p value continues!
It became a custom to cite the article as a brief way of indicating adoption of the new statistics in a journal article.
Revisiting that article, what would you have done differently?
I used the term ‘research integrity’ all through. The term ‘Open Science’ was coming into use and I soon realized that was way better, and what I would have used even a few months later. If reading the article today, I suggest doing a mental search-and-replace of every ‘research integrity’ with ‘Open Science’.
Otherwise, I think the article has held up well, including all 25 guidelines in the article’s Table 1, reprinted below.
Table 1. Twenty-Five Guidelines for Improving Psychological Research
| 1. Promote research integrity: (a) a public research literature that is complete and trustworthy and (b) ethical practice, including full and accurate reporting of research. |
| 2. Understand, discuss, and help other researchers appreciate the challenges of (a) complete reporting, (b) avoiding selection and bias in data analysis, and (c) replicating studies. |
| 3. Make sure that any study worth doing properly is reported, with full details. |
| 4. Make clear the status of any result—whether it deserves the confidence that arises from a fully prespecified study or is to some extent speculative. |
| 5. Carry out replication studies that can improve precision and test robustness, and studies that provide converging perspectives and investigate alternative explanations. |
| 6. Build a cumulative quantitative discipline. |
| 7. Whenever possible, adopt estimation thinking and avoid dichotomous thinking. |
| 8. Remember that obtained results are one possibility from an infinite sequence. |
| 9. Do not trust any p value. |
| 10. Whenever possible, avoid using statistical significance or p values; simply omit any mention of null-hypothesis significance testing (NHST). |
| 11. Move beyond NHST and use the most appropriate methods, whether estimation or other approaches. |
| 12. Use knowledgeable judgment in context to interpret observed effect sizes (ESs). |
| 13. Interpret your single confidence interval (CI), but bear in mind the dance. Your 95% CI just might be one of the 5% that miss. As Figure 1 illustrates, it might be red! |
| 14. Prefer 95% CIs to SE bars. Routinely report 95% CIs, and use error bars to depict them in figures. |
| 15. If your ES of interest is a difference, use the CI on that difference for interpretation. Only in the case of independence can the separate CIs inform interpretation. |
| 16. Consider interpreting ESs and CIs for preselected comparisons as an effective way to analyze results from randomized control trials and other multiway designs. |
| 17. When appropriate, use the CIs on correlations and proportions, and their differences, for interpretation |
| 18. Use small- or large-scale meta-analysis whenever that helps build a cumulative discipline. |
| 19. Use a random-effects model for meta-analysis and, when possible, investigate potential moderators. |
| 20. Publish results so as to facilitate their inclusion in future meta-analyses. |
| 21. Make every effort to increase the informativeness of planned research. |
| 22. If using NHST, consider and perhaps calculate power to guide planning. |
| 23. Beware of any power statement that does not state an ES; do not use post hoc power. |
| 24. Use a precision-for-planning analysis whenever that may be helpful. |
| 25. Adopt an estimation perspective when considering issues of research integrity. |
What has happened since
Psychological Science has continued to lead in the adoption of Open Science practices. Subsequent editors, especially Steve Lindsay and Simine Vazire, have progressively built on Eich’s pioneering work.
More broadly, the field of meta-science, also known as meta-research, has emerged and is thriving as a highly multi-disciplinary field that applies the methods of science to evaluate and improve how research is being conducted. Applying the scientific method to improve that method—a highly welcome development!
What have you been doing since?
Rather than updating my 2012 book to include Open Science, I teamed with Robert Calin-Jageman to write the first intro statistics textbook based on the new statistics and with Open Science all through. We also included NHST, introducing this in Chapter 6 with many ‘red flag’ warnings of p value pitfalls. The book was Introduction to The New Statistics: Estimation, Open Science, and Beyond, 2nd edition (2017). It received a positive reception but was not very widely adopted, I believe mainly because of limitations of my ESCI software in Excel, which had no path to higher level courses.
Earlier this year the second edition appeared, with very much better software, esci (estimation statistics with confidence intervals) that has two components. These are esci web, by Gordon Moore, a set of simulations and tools that runs in any browser; and esci, by Bob Calin-Jageman, an open-source data analysis application in R that can be run in R or as a module in jamovi (and soon in JASP). esci emphasizes the new statistics but also supports NHST, including evaluation of interval null hypotheses. It provides excellent figures with CIs. It is ideal for the intro book, and extends seamlessly to more advanced courses and use by researchers. We believe this book can sweep the world—we’ll see! To read the Preface and Chapter 1 go to www.thenewstatistics.com. In the second para is a link to the book’s Amazon site. Click ‘Read sample.’
I should mention also our latest article (Calin-Jageman & Cumming, 2024), on open access, which briefly makes the case for the new statistics and Open Science with an emphasis on three dramatic demonstrations of the extreme unreliability of p values. It then describes esci web and esci, with a range of worked examples. Worth an explore. See our site (www.thenewstatistics.com) for information about our books and software, and our blog.
References
Calin-Jageman, R., & Geoff Cumming, G. (2024). From significance testing to estimation and Open Science: How esci can help. International Journal of Psychology, https://doi.org/10.1002/ijop.13132
Cumming, G. (2012). The New Statistics: Effect sizes, confidence intervals, and meta-analysis. New York: Routledge.
Cumming, G. (2014) The new statistics: Why and how. Psychological Science. 25(1), 7-29. https://doi.org/10.1177/0956797613504966
Cumming, G., & Calin-Jageman, R. (2017). Introduction to The New Statistics: Estimation, Open Science, & Beyond. New York: Routledge.
Cumming, G., & Calin-Jageman, R. (2024). Introduction to The New Statistics: Estimation, Open Science, & Beyond, 2nd edition. New York: Routledge.
Eich, E. (2014) Business not as usual. Psychological Science, 25(1), 3–6. https://doi.org/10.1177/0956797613512465
Gigerenzer, G., & Murray, D. J. (1987). Cognition as intuitive statistics. Hillsdale, NJ: Erlbaum.
Ioannidis, J. P. A. (2005). Why most published research findings are false. PLoS Medicine 2: e124. https://doi.org/10.1371/journal.pmed.0020124
Meehl, P. E. (1978). Theoretical risks and tabular asterisks: Sir Karl, Sir Ronald, and the slow progress of soft psychology. Journal of Consulting and Clinical Psychology, 46, 806–834. https://doi.org/10.1037/0022-006X.46.4.806
Schmidt, F. L. (1996). Statistical significance testing and cumulative knowledge in psychology: Implications for training of researchers. Psychological Methods, 1(2), 115-129. https://doi.org./10.1037/1082-989X.1.2.115