Research
 Human Progress – A new free research tool with a lot of potential
This week I heard about an amazing site called HumanProgress.org through the Cato Institute, so I thought I’d share this research tool with the rest of you SSSpace readers.
The Human Progress website is a meticulously created and managed database that steadily follows and documents human progress. It is a free research tool that saddles the line between our normal pessimistic outlooks and that of a more optimistic reality. Users can search and explore a wide range of things from development indicators, then use them to compare and contrast different populations with one another and over time. Users can also create stunning graphics that are packed full of information.
Some of the indicators you can look at are:
- Infant mortality rates
- Wealth
- Health
- Literacy rates
- Working time
- The transition to alternative energy sources
- Access to information and education
- Travel
- Political and economic freedom
For quick trial, I decided to look at education because it’s something I’m always interested in. Then I chose literacy rates of people (either gender) between 15 and 24. They have data from 1975 to 2009 currently, but you can further divide it into looking at a cross section of the data across regions, economic freedom, another human development indicator, or even income. There is also a slider across the screen so you can widen or narrow down the years you want to look into. For mine, I choose the years 1995 – 2009, then downloaded this image. I can even change the comparison ratio. Currently the data is set to compare every one to India and China for this map.
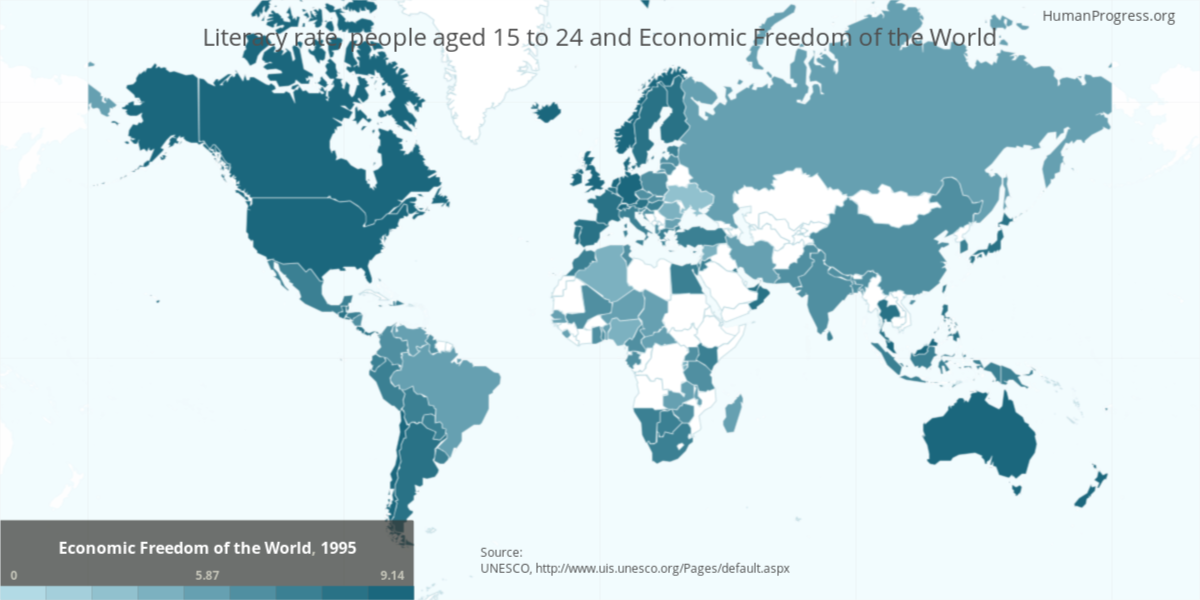
This trial map is just basic. There are a few other options, such as pop-ups over countries of interest. (Click for a bigger image.)
My first test of the system I choose economic freedom to see how countries from around the world compared for this age group. Below this map, I can see a data graph, some information about where they got the data, and perhaps more importantly, related literature and videos.
This is already pretty good, if you ask me. They are constantly working on it and making it better by adding more data from more resources every day. This is already a fun tool to use, but I can see it being very productive for our research as well. As an educator, I hope to use this tool to compare data with how well the education system has worked over time. As a business person I hope to use this to help my clients and customers all over the world make better products to heighten their progress. Though, I’m curious, how do you see yourself using this in your research?